Experiment 7b: Labelled RDK - Wordle Reward
knowlabUnimelb
2022-04-10
Last updated: 2022-11-09
Checks: 7 0
Knit directory: SCHEDULING/
This reproducible R Markdown analysis was created with workflowr (version 1.7.0). The Checks tab describes the reproducibility checks that were applied when the results were created. The Past versions tab lists the development history.
Great! Since the R Markdown file has been committed to the Git repository, you know the exact version of the code that produced these results.
Great job! The global environment was empty. Objects defined in the global environment can affect the analysis in your R Markdown file in unknown ways. For reproduciblity it’s best to always run the code in an empty environment.
The command set.seed(20221107) was run prior to running
the code in the R Markdown file. Setting a seed ensures that any results
that rely on randomness, e.g. subsampling or permutations, are
reproducible.
Great job! Recording the operating system, R version, and package versions is critical for reproducibility.
Nice! There were no cached chunks for this analysis, so you can be confident that you successfully produced the results during this run.
Great job! Using relative paths to the files within your workflowr project makes it easier to run your code on other machines.
Great! You are using Git for version control. Tracking code development and connecting the code version to the results is critical for reproducibility.
The results in this page were generated with repository version 67e1aac. See the Past versions tab to see a history of the changes made to the R Markdown and HTML files.
Note that you need to be careful to ensure that all relevant files for
the analysis have been committed to Git prior to generating the results
(you can use wflow_publish or
wflow_git_commit). workflowr only checks the R Markdown
file, but you know if there are other scripts or data files that it
depends on. Below is the status of the Git repository when the results
were generated:
Ignored files:
    Ignored:    .Rproj.user/
    Ignored:    analysis/patch_selection.png
    Ignored:    analysis/patch_selection_8.png
    Ignored:    analysis/patch_selection_avg.png
    Ignored:    analysis/site_libs/

Untracked files:
    Untracked:  analysis/Notes.txt
    Untracked:  analysis/archive/
    Untracked:  analysis/fd_pl.rds
    Untracked:  analysis/fu_pl.rds
    Untracked:  analysis/prereg/
    Untracked:  analysis/reward rate analysis.docx
    Untracked:  analysis/rewardRate.jpg
    Untracked:  analysis/toAnalyse/
    Untracked:  analysis/wflow_code_string.txt
    Untracked:  archive/
    Untracked:  data/archive/
    Untracked:  data/create_database.sql
    Untracked:  data/dataToAnalyse/
    Untracked:  data/exp6a_typing_exponential.xlsx
    Untracked:  data/exp6b_typing_linear.xlsx
    Untracked:  data/rawdata_incEmails/
    Untracked:  data/sona data/
    Untracked:  data/summaryFiles/
    Untracked:  models/
    Untracked:  old Notes on analysis.txt
    Untracked:  presentations/
    Untracked:  references/
    Untracked:  spatial_pdist.Rdata

Unstaged changes:
    Modified:   data/README.md
Note that any generated files, e.g. HTML, png, CSS, etc., are not included in this status report because it is ok for generated content to have uncommitted changes.
These are the previous versions of the repository in which changes were
made to the R Markdown
(analysis/analysis_exp7b_rdk_reward.Rmd) and HTML
(docs/analysis_exp7b_rdk_reward.html) files. If you’ve
configured a remote Git repository (see ?wflow_git_remote),
click on the hyperlinks in the table below to view the files as they
were in that past version.
| File | Version | Author | Date | Message |
|---|---|---|---|---|
| Rmd | 67e1aac | knowlabUnimelb | 2022-11-09 | Publish data and analysis files |
Sandra Takchi1, Ami Eidels2, and Daniel R. Little1 1 The University of Melbourne, 2 The University of Newcastle
Method
Participants
53 participants were recruited through the Melbourne School of Psychological Sciences Research Experience Program, and they were reimbursed by earning one credit for each hour of participation. 38 of the participants were females and 9 were males, and their mean age was 19.2 with a standard deviation of 2.4. Participants who did not complete the whole experiment or were not able to learn the task were excluded from the experiment. 44 participants remained in the analysis after these exclusion.
Design
Participants completed a series of trials of selecting and completing RDK tasks. They were instructed to make judgment about the direction of the dots in the RDK tasks, where they attempted to complete as many subtasks as possible before the deadline. In addition, a wordle game was introduced, and participants gained clues that varied by value depending on the order of subtask difficulty they followed. The reward with the highest value was gained when they started with the most difficult task and the one with the least value was gained when they started with the easiest task.
Data Cleaning
Subjects completed the experiment by clicking a link with the uniquely generated id code. Subjects were able to use the link multiple times; further, subjects were able to exit the experiment at any time. Consequently, the datafile contains partially completed data for some subjects which needed to be identified and removed.
We identified non-learners as participants who had less than 40% accuracy on the easiest task. These participants were removed.
Data Analysis
We first summarized performance by answering the following questions:
Task completions
- How many tasks are completed on average?
We assumed that by adding a deadline, participants will complete less tasks then when it is untimed. Hence, we inspected this assumption by calculating the average number of task completions for the timed and untimed phases.
| phase | mean |
|---|---|
| untimed | 3.927401 |
| deadline | 3.375682 |
As expected, in the untimed phase, average correct completed tasks were higher than the phase with the deadline. The deadline reduced the number of tasks completed.
RDK performance
We next analysed performance on the RDK discriminations. We then asked:
- What was the average completion time and accuracy of the easy, medium, hard, and very hard tasks?
We assumed that participants will spend the most time and have a lower accuracy on the most difficult task compared to the easiest one. To check this effect of difficulty, we calculated the average completion time and accuracy of each difficulty.
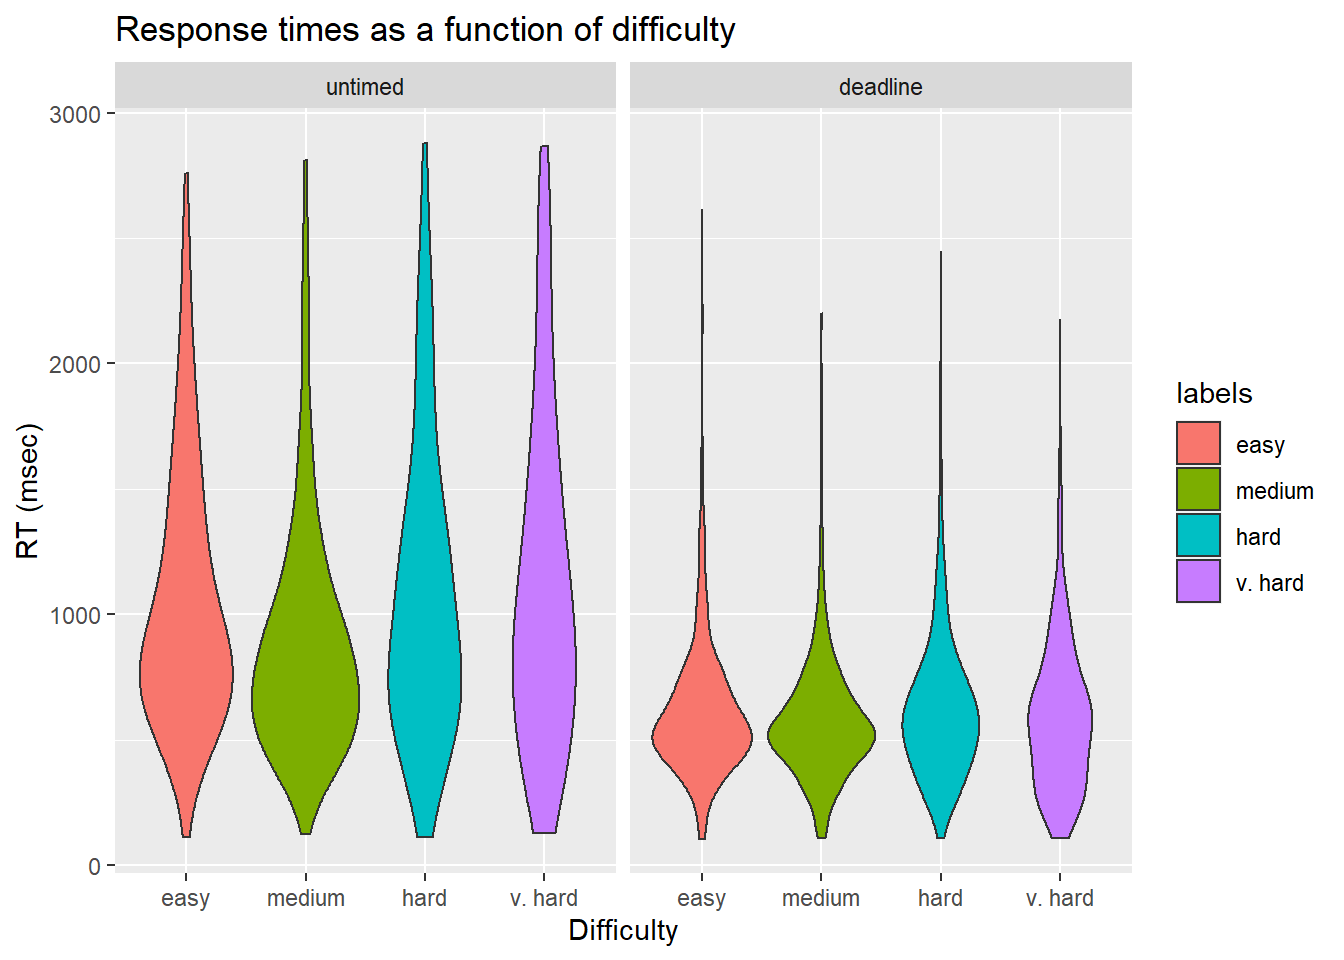
On average, accuracy decreased as the task difficulty increased, and response time increased as difficulty increased.
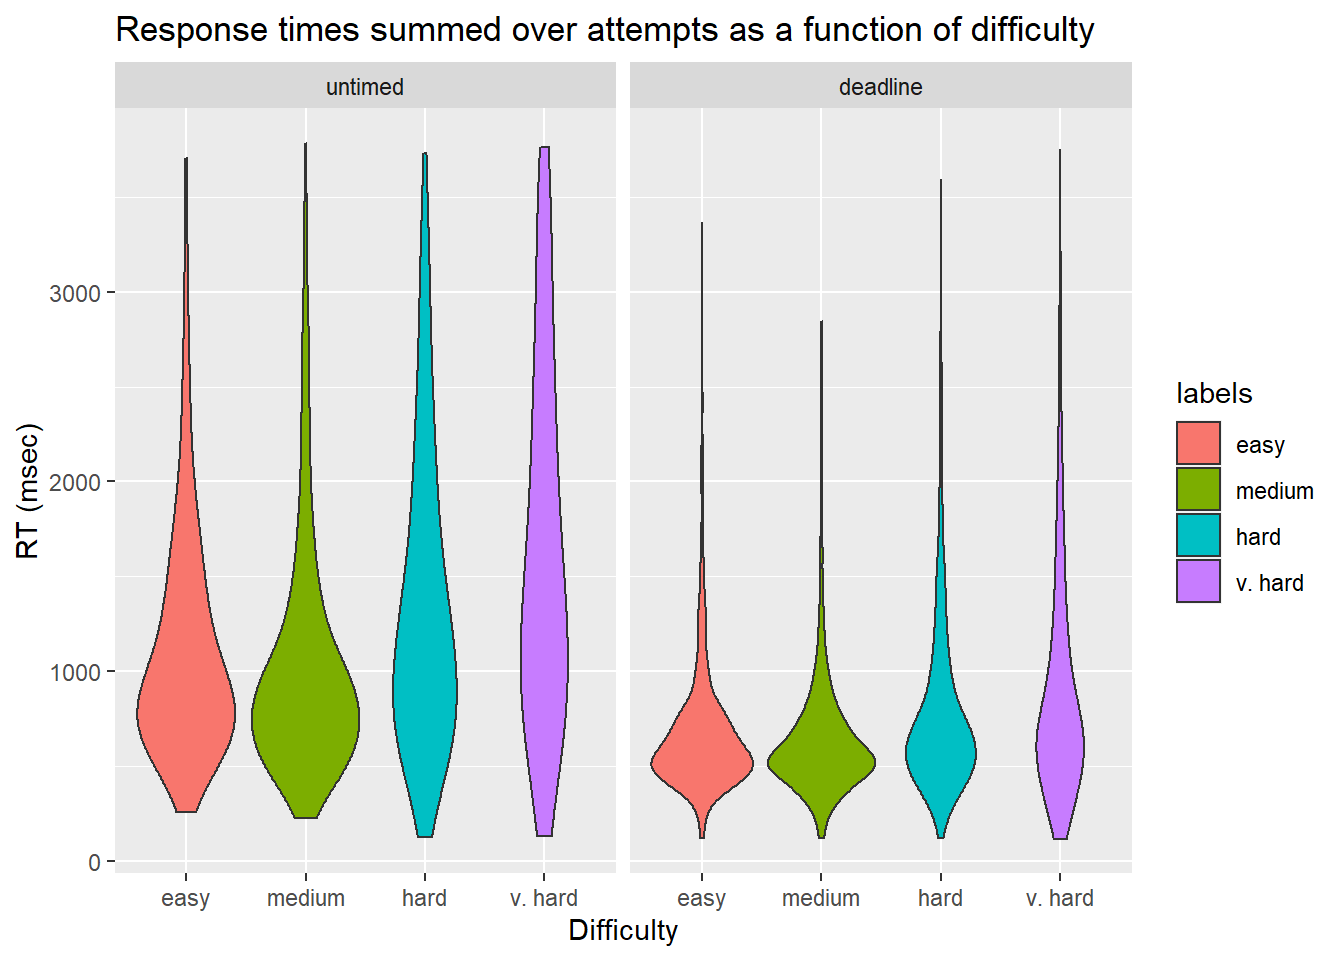
We further broke down RTs by condition, deadline, and difficulty.
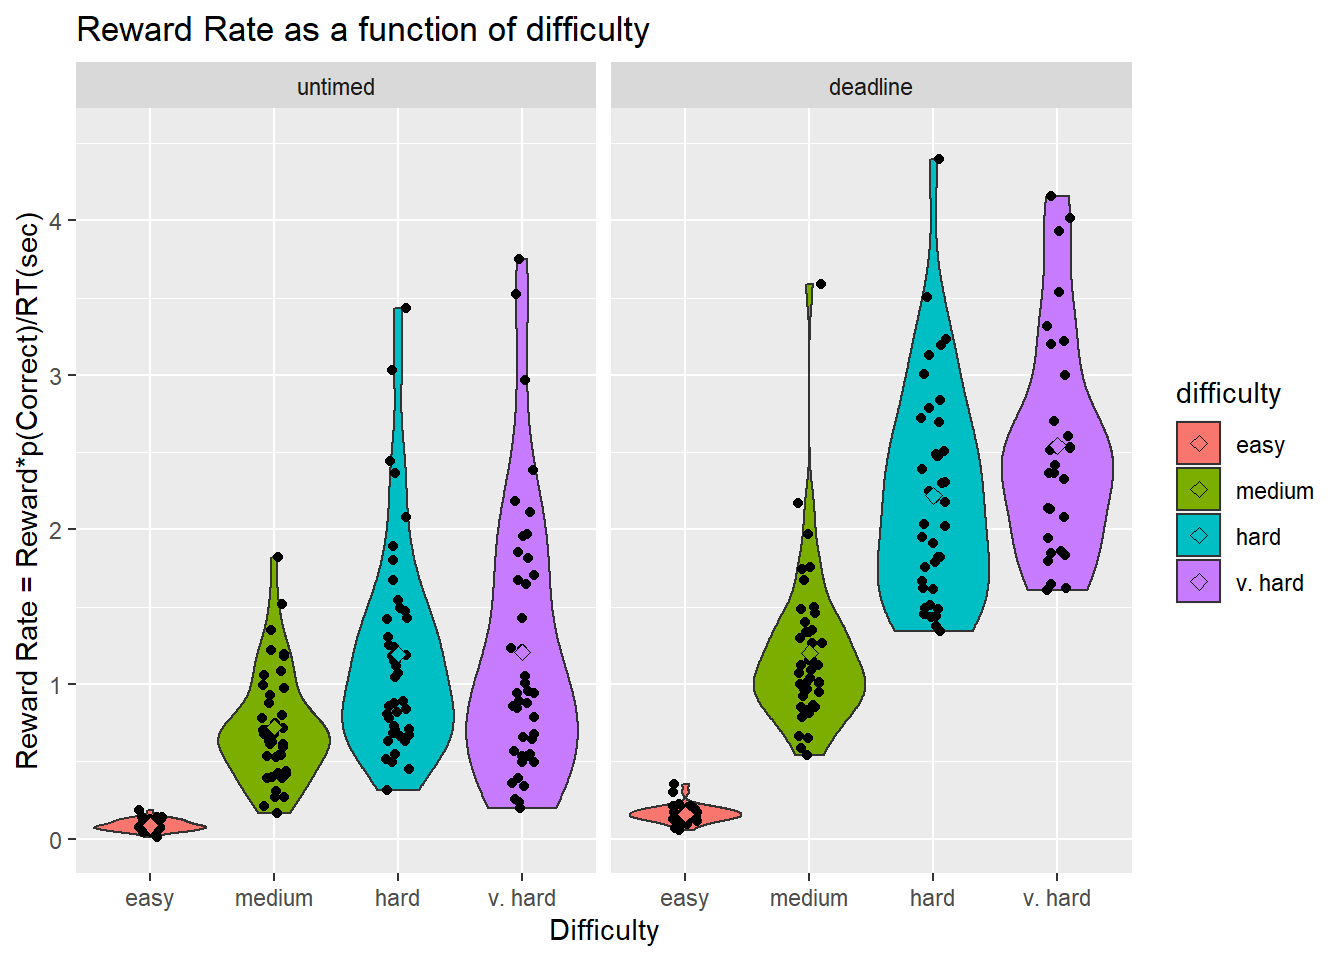
Reward Rate
Reward rate is the reward amount of each task divided by the time needed to complete it. The optimal order is determined by ordering the tasks according to the tasks which produces the highest value reward per unit time.
 ANOVA
Table (type III tests)
ANOVA
Table (type III tests)
$ANOVA Effect DFn DFd F p p<.05 ges 1 phase 1 41 43.431 6.27e-08 * 0.134 2 difficulty 3 123 47.351 2.05e-20 * 0.295 3 phase:difficulty 3 123 25.595 6.19e-13 * 0.104
$Mauchly's Test for Sphericity Effect W p p<.05 1
difficulty 0.025 7.64e-30 2 phase:difficulty 0.018 1.05e-32
$Sphericity Corrections Effect GGe DF[GG] p[GG]
p[GG]<.05 HFe DF[HF] 1 difficulty 0.422 1.26, 51.85 5.97e-10 * 0.429
1.29, 52.75 2 phase:difficulty 0.430 1.29, 52.9 8.25e-07 * 0.438 1.31,
53.88 p[HF] p[HF]<.05 1 4.40e-10 2 6.75e-07
Pairwise comparisons using t tests with pooled SD data: rrdata\(rewardRate and paste(rrdata\)difficulty, rrdata$phase)
easy deadline easy untimed hard deadline hard untimedeasy untimed 1.00000 - - -
hard deadline 8.4e-12 1.9e-12 - -
hard untimed 0.05979 0.02816 0.00026 -
medium deadline 0.05593 0.02624 0.00028 1.00000
medium untimed 1.00000 1.00000 2.2e-07 1.00000
v. hard deadline < 2e-16 < 2e-16 0.00039 1.1e-15
v. hard untimed 0.00868 0.00369 0.00261 1.00000
medium deadline medium untimed v. hard deadline easy untimed - - -
hard deadline - - -
hard untimed - - -
medium deadline - - -
medium untimed 1.00000 - -
v. hard deadline 1.3e-15 < 2e-16 -
v. hard untimed 1.00000 1.00000 5.5e-14
P value adjustment method: bonferroni
| phase | difficulty | n | Mean.Correct | SE.Correct | Mean.RT | SE.RT | Mean.crt | SE.crt | Mean.RR | SE.RR |
|---|---|---|---|---|---|---|---|---|---|---|
| untimed | easy | 757 | 0.94 | 0.01 | 1356.00 | 52.59 | 1435.96 | 61.87 | 0.0854024 | 0.0012642 |
| untimed | medium | 553 | 0.86 | 0.01 | 972.94 | 30.21 | 1136.24 | 40.98 | 0.7211885 | 0.0151219 |
| untimed | hard | 494 | 0.76 | 0.02 | 1387.68 | 56.43 | 1831.47 | 83.13 | 1.1951377 | 0.0305717 |
| untimed | v. hard | 449 | 0.55 | 0.02 | 1544.42 | 64.69 | 2810.40 | 132.33 | 1.3791243 | 0.0546410 |
| deadline | easy | 1508 | 0.91 | 0.01 | 606.97 | 7.80 | 661.56 | 9.43 | 0.1601105 | 0.0014105 |
| deadline | medium | 1408 | 0.89 | 0.01 | 555.37 | 6.48 | 619.47 | 8.72 | 1.2019447 | 0.0137879 |
| deadline | hard | 1295 | 0.76 | 0.01 | 607.24 | 8.46 | 769.57 | 13.38 | 2.7019247 | 0.0481121 |
| deadline | v. hard | 1321 | 0.60 | 0.01 | 569.25 | 8.62 | 855.86 | 16.59 | 4.1847550 | 0.1041315 |
Optimality in each condition
- What is the proportion of easy, medium, hard, and very hard tasks selected first, second, third or fourth?
To assess participants’ optimality, we looked into the order in which they adopted, visualized in heat maps that portray the proportion of selecting tasks of particular difficulties.
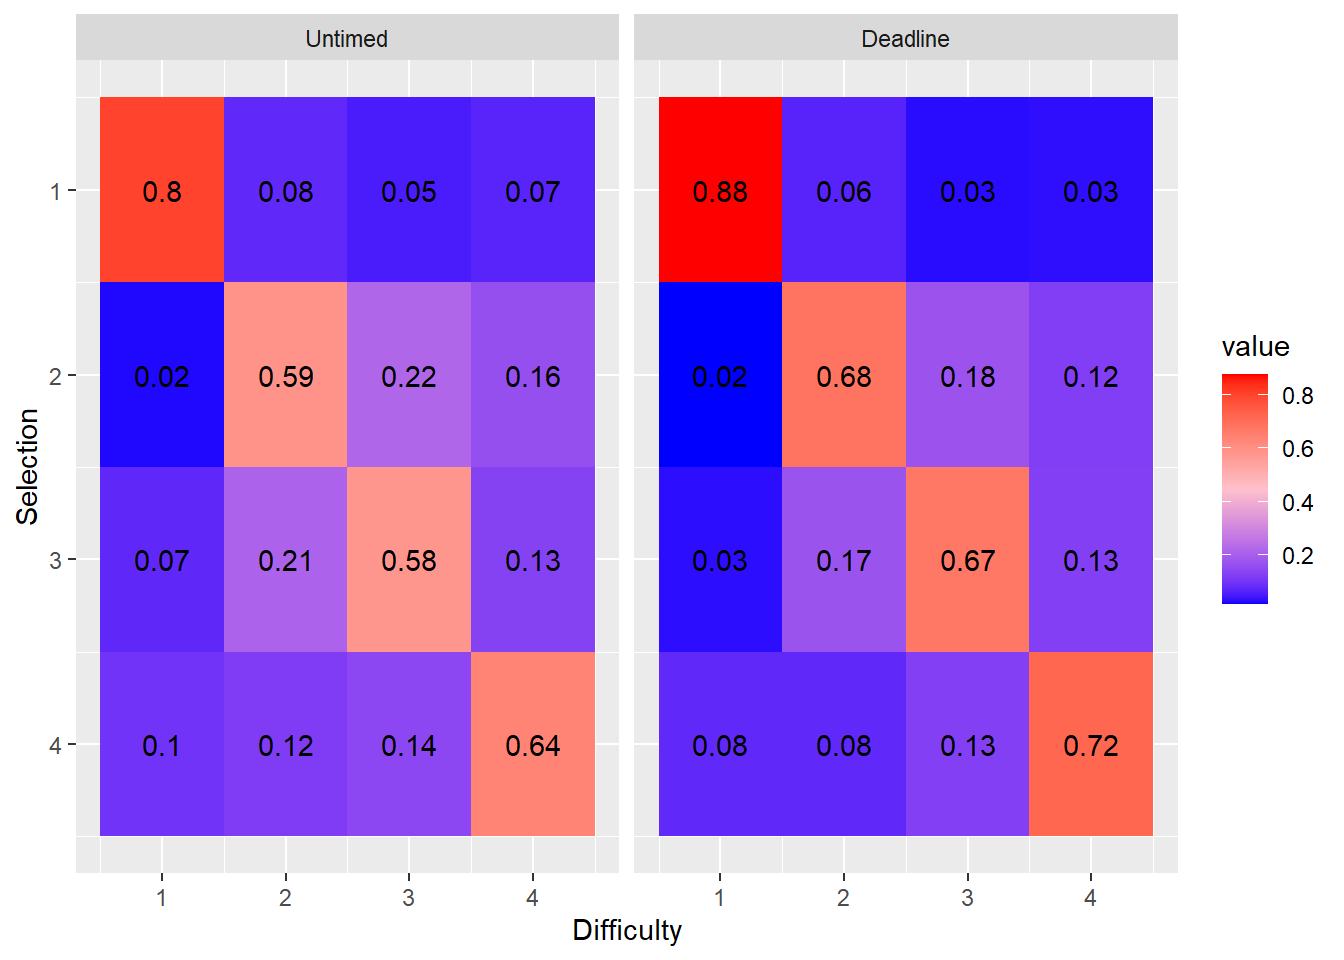
- Do the marginal distributions differ from uniformity?
We tested whether the marginal distributions were different from uniformally random selection using the fact that the mean rank is distributed according to a \(\chi^2\) distribution with the following test-statistic: \[\chi^2 = \frac{12N}{k(k+1)}\sum_{j=1}^k \left(m_j - \frac{k+1}{2} \right)^2\] see (Marden, 1995).
| phase | chi2 | df | p |
|---|---|---|---|
| untimed | 485.97 | 3 | 0 |
| deadline | 2086.43 | 3 | 0 |
A chi-square test of uniformity was significant, indicating that participants did not choose tasks of different difficulty by random.
We compared the location conditions and phases using chi-2 analysis.
| Comparison | chi2 | df | p | |
|---|---|---|---|---|
| X-squared | Untimed vs Deadline | 57.23 | 15 | 0 |
A Pearson’s chi-square test indicated that there was a significant difference between the untimed and deadline phases in the order participants adopted.
K-S test was significant, meaning that the probability distributions between timed and untimed phases are not the same.
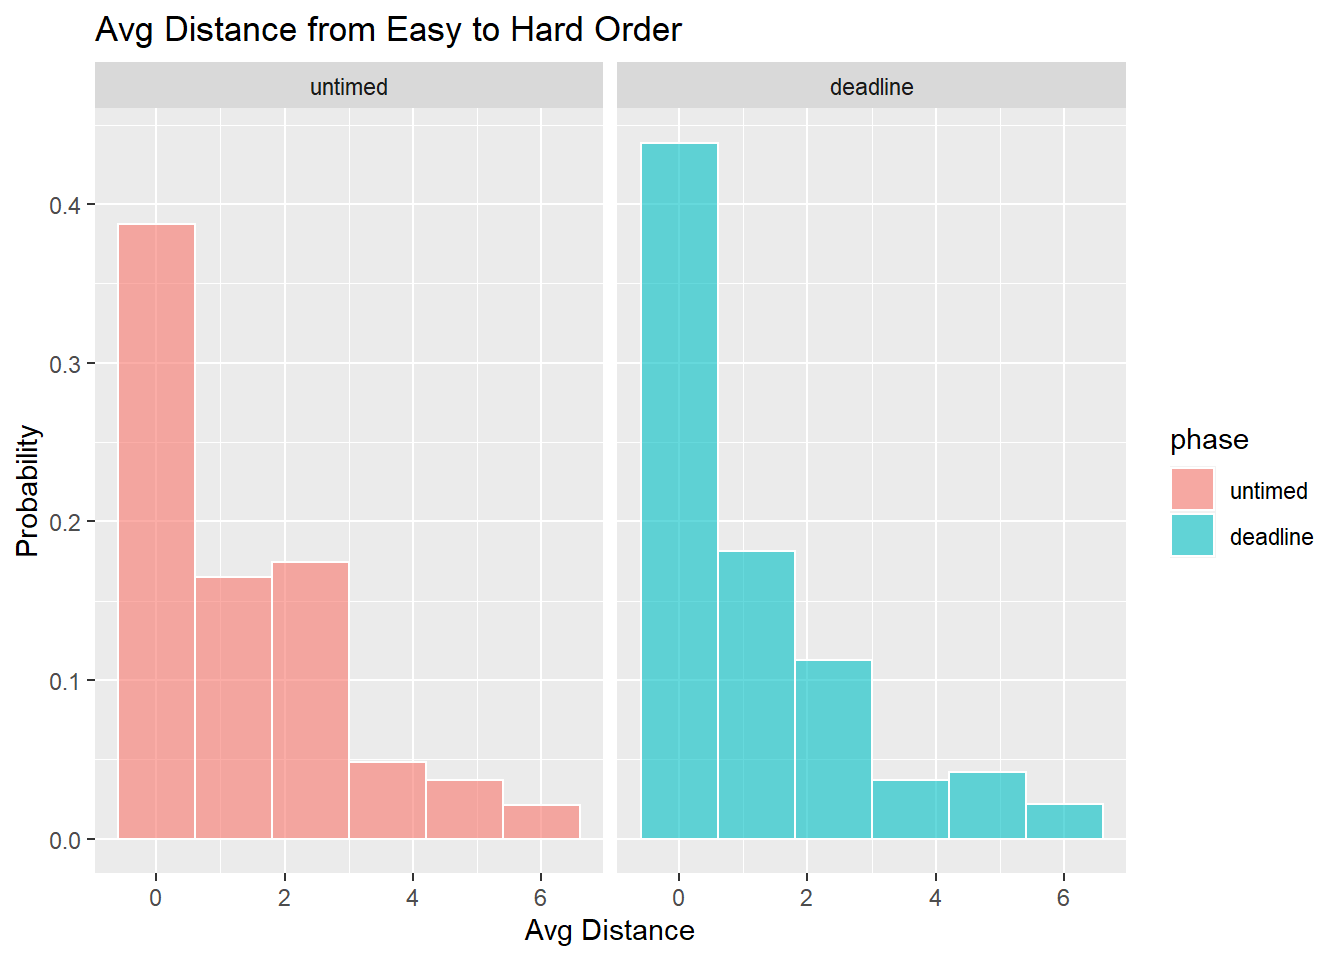
- How optimal were responses?
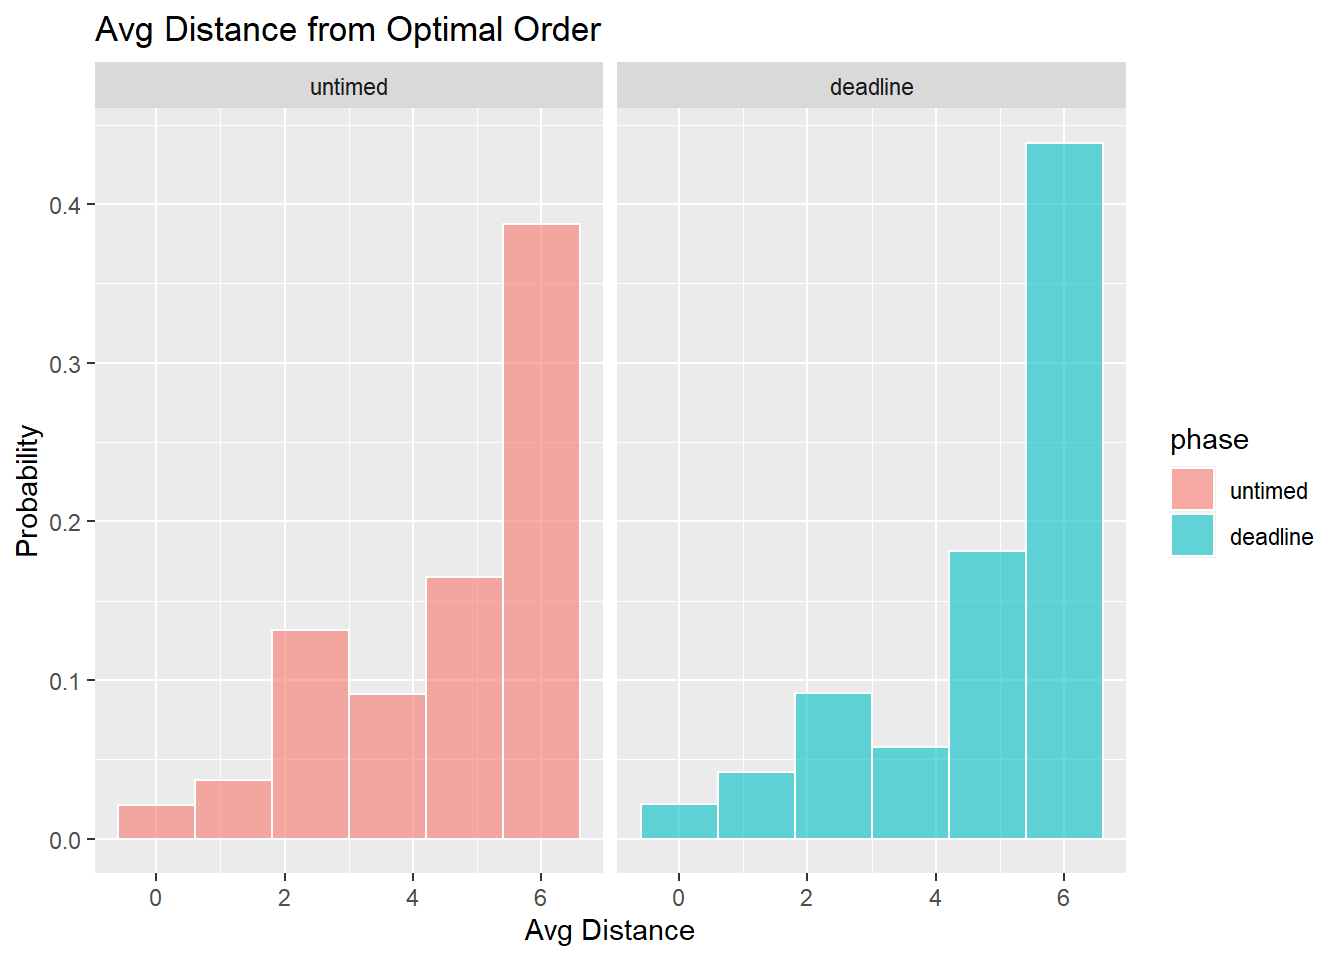
Participants were not optimal, since they followed an easy to hard order even when the hardest task produced the highest value reward.
Comparison against Easy to Hard order
- How consistent were responses with an easy to hard ordering?
Wordle-Clue Score Analysis
- How motivated are participants to get the Wordle-Clue guess correct?
Wordle guesses are scored out of 10. A match-in-place is scored 2; a match-out-of-place is scored 1. The final score for each trial is the sum across all letters.
| phase | score |
|---|---|
| untimed | 5.154348 |
| deadline | 4.609420 |
Df Sum Sq Mean Sq F value Pr(>F)phase 1 6.83 6.83 2.218 0.14 Residuals 90 277.18 3.08
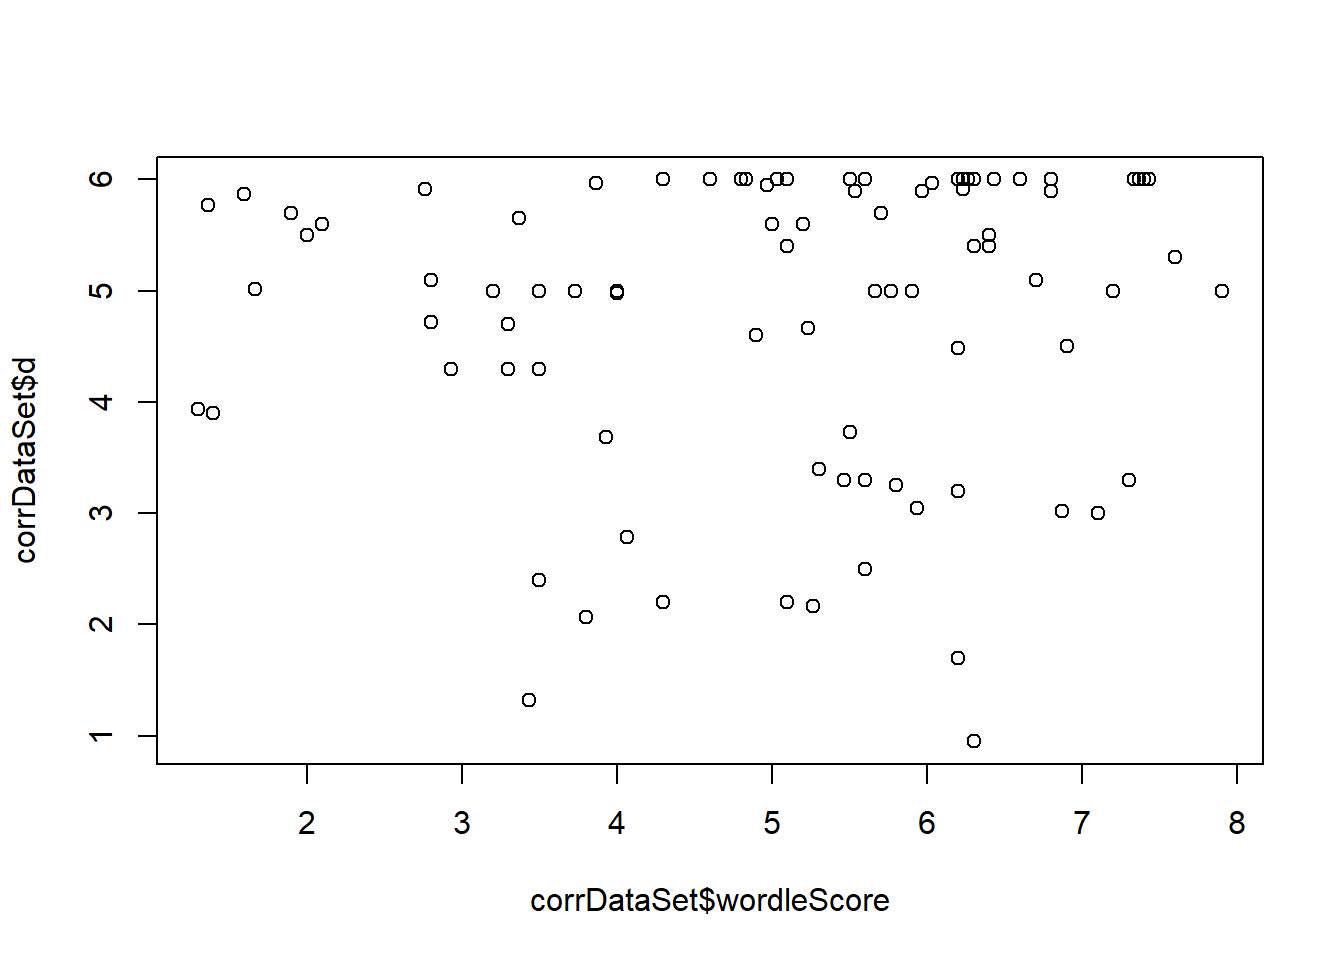
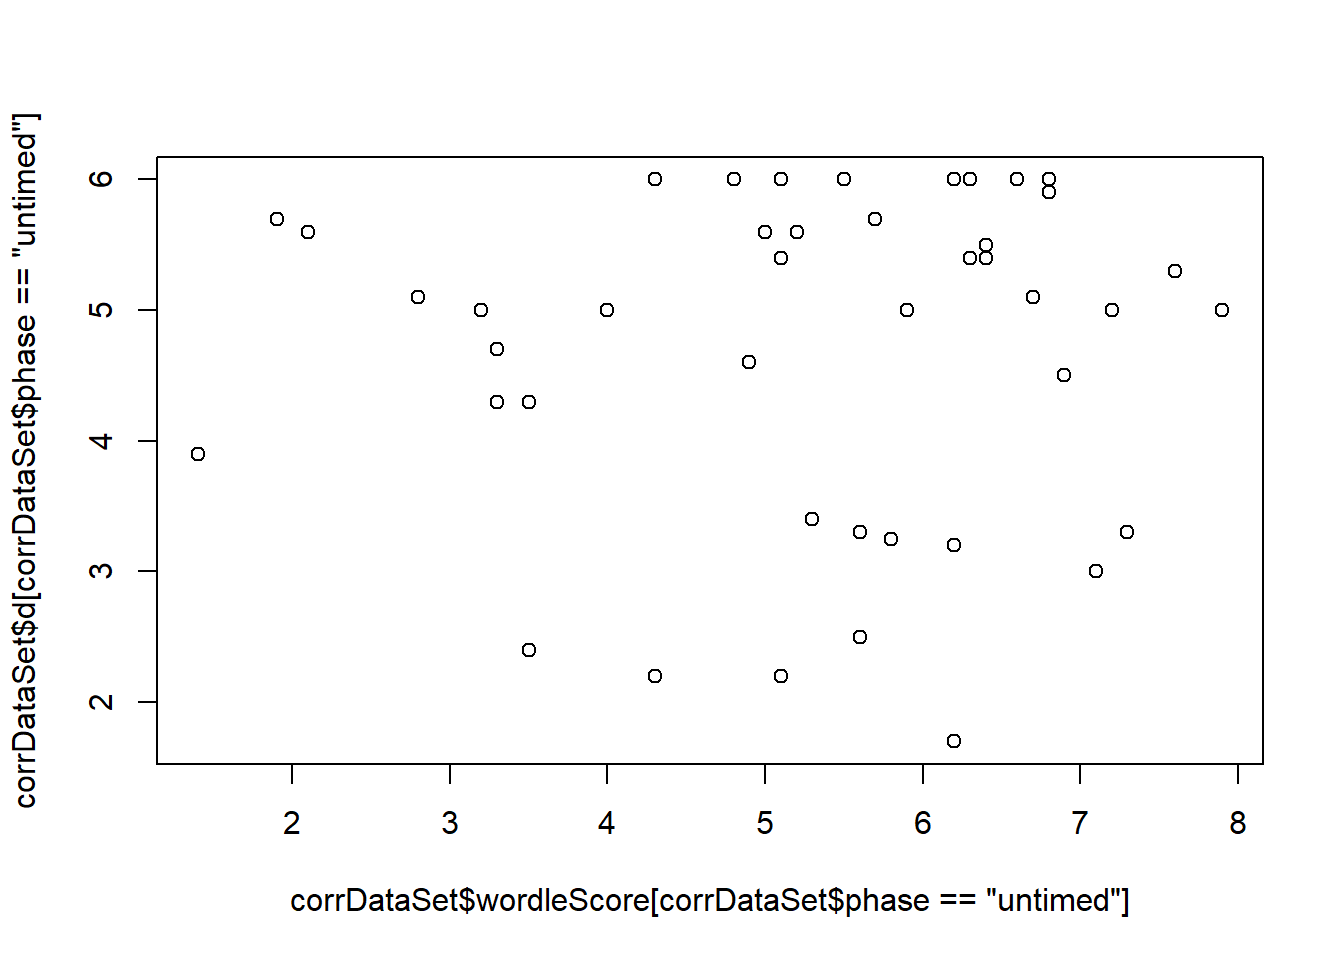
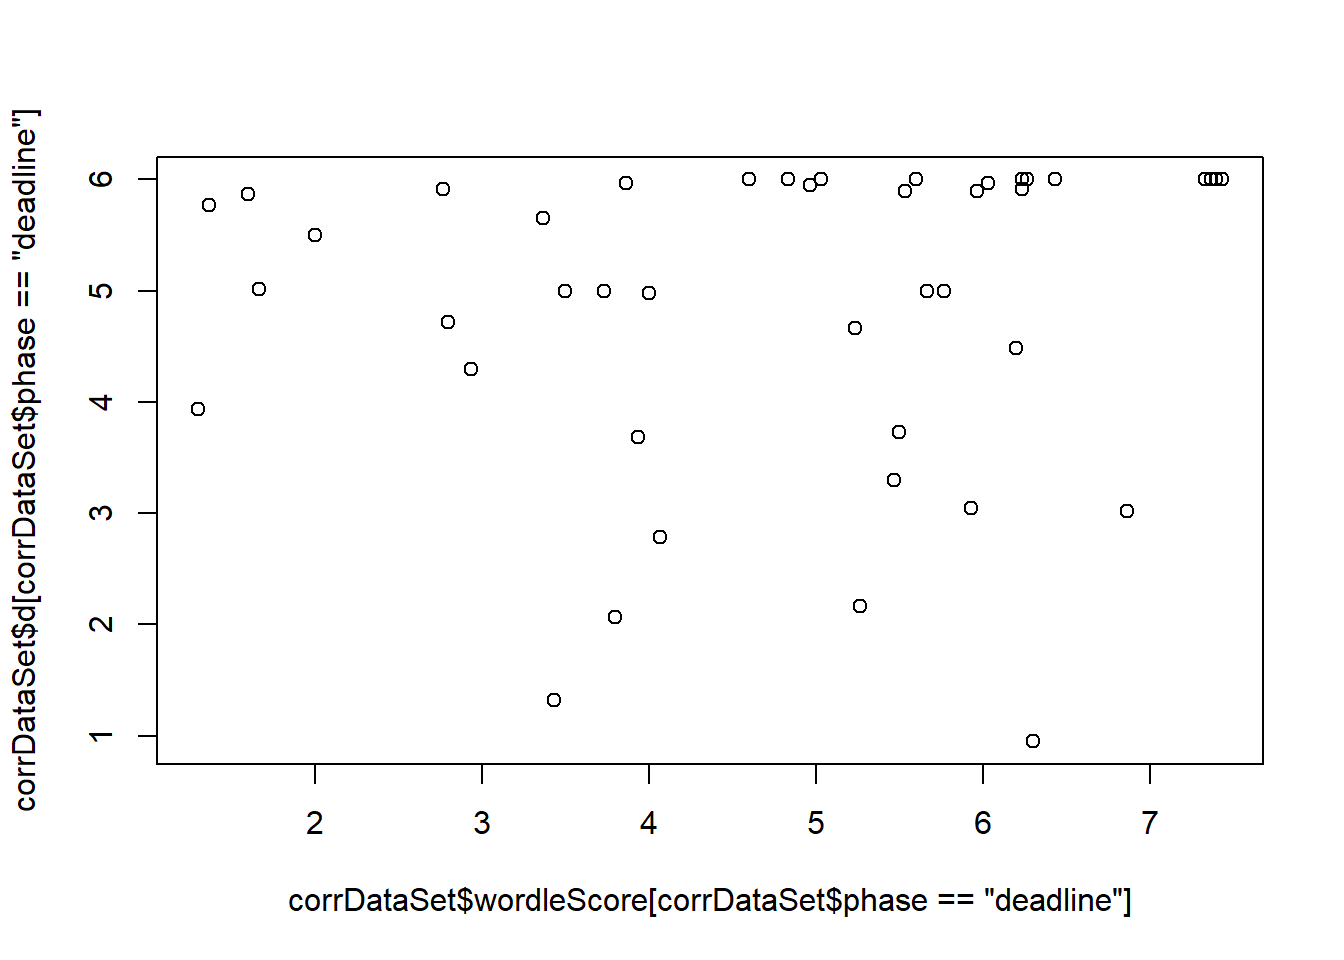
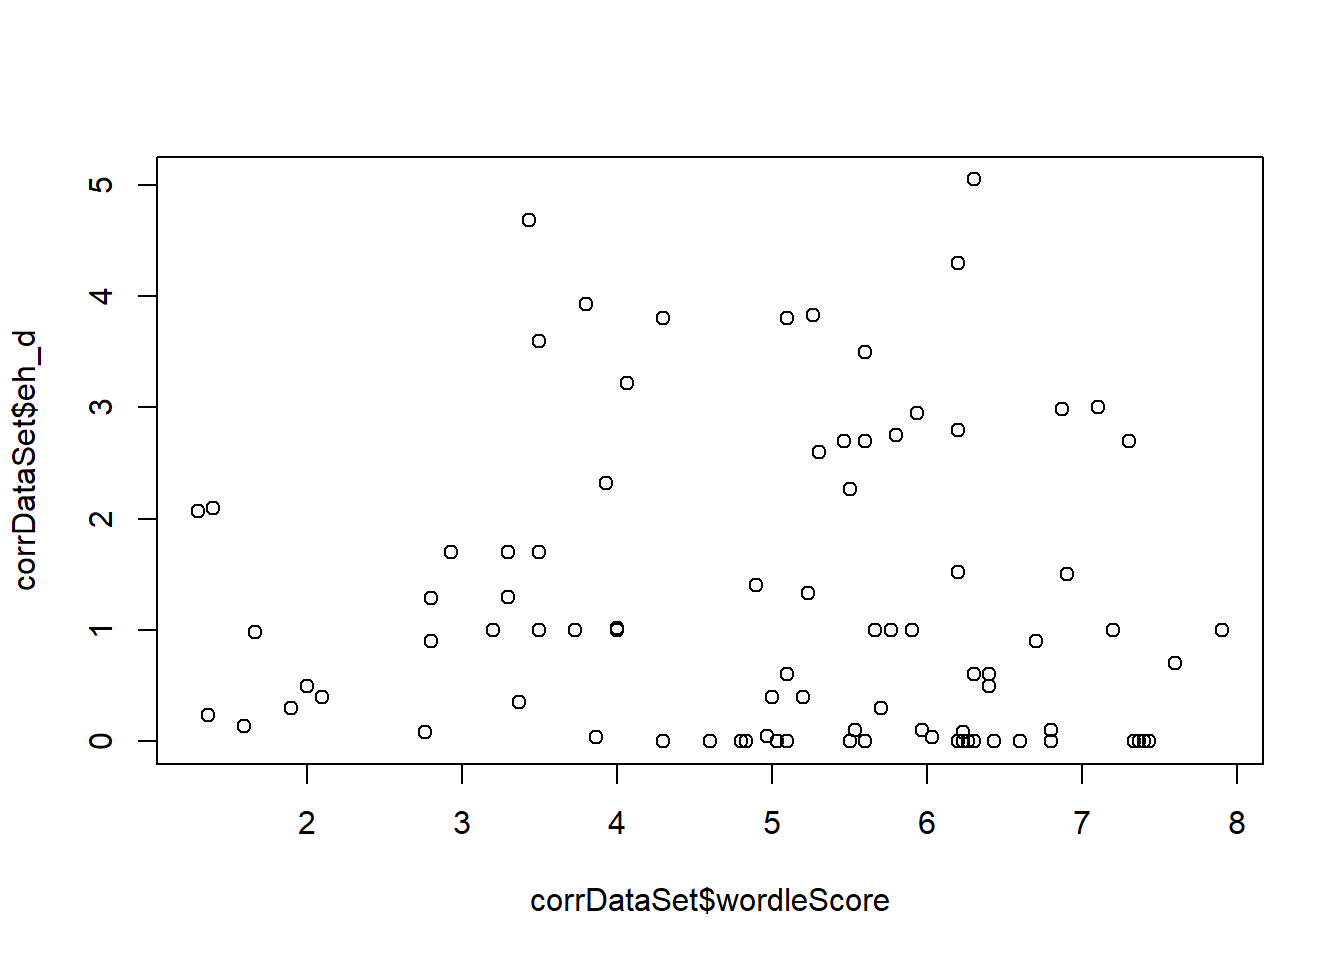
- What is the correlation between the Wordle-Clue score and the distance from the optimal schedule? From the easy-hard schedule?
This test indicates whether participants who are more motivated to score highly on the wordle test are also more likely to selection optimal schedules. This would be indicated by a significant correlation (high wordle score coupled with a low average distance). We also test the same wordle score compared to the easy-hard schedule.
 [1]
0.05445635
[1]
0.05445635
Pearson's product-moment correlationdata: corrDataSet\(wordleScore and corrDataSet\)d t = 0.49984, df = 84, p-value = 0.6185 alternative hypothesis: true correlation is not equal to 0 95 percent confidence interval: -0.1592565 0.2632938 sample estimates: cor 0.05445635
 [1]
0.03669444
[1]
0.03669444
Pearson's product-moment correlationdata: corrDataSet\(wordleScore[corrDataSet\)phase == “untimed”] and corrDataSet\(d[corrDataSet\)phase == “untimed”] t = 0.23512, df = 41, p-value = 0.8153 alternative hypothesis: true correlation is not equal to 0 95 percent confidence interval: -0.2665875 0.3333643 sample estimates: cor 0.03669444
 [1]
0.0882251
[1]
0.0882251
Pearson's product-moment correlationdata: corrDataSet\(wordleScore[corrDataSet\)phase == “deadline”] and corrDataSet\(d[corrDataSet\)phase == “deadline”] t = 0.56713, df = 41, p-value = 0.5737 alternative hypothesis: true correlation is not equal to 0 95 percent confidence interval: -0.2178924 0.3785385 sample estimates: cor 0.0882251
 [1]
-0.05445635
[1]
-0.05445635
Pearson's product-moment correlationdata: corrDataSet\(wordleScore and corrDataSet\)eh_d t = -0.49984, df = 84, p-value = 0.6185 alternative hypothesis: true correlation is not equal to 0 95 percent confidence interval: -0.2632938 0.1592565 sample estimates: cor -0.05445635
sessionInfo()R version 4.1.3 (2022-03-10)
Platform: x86_64-w64-mingw32/x64 (64-bit)
Running under: Windows 10 x64 (build 19042)
Matrix products: default
locale:
[1] LC_COLLATE=English_Australia.1252 LC_CTYPE=English_Australia.1252
[3] LC_MONETARY=English_Australia.1252 LC_NUMERIC=C
[5] LC_TIME=English_Australia.1252
attached base packages:
[1] stats4 grid stats graphics grDevices utils datasets
[8] methods base
other attached packages:
[1] pmr_1.2.5.1 jpeg_0.1-9 rstatix_0.7.0 lme4_1.1-29
[5] Matrix_1.4-0 png_0.1-7 reshape2_1.4.4 knitr_1.38
[9] hrbrthemes_0.8.0 english_1.2-6 gtools_3.9.2 DescTools_0.99.45
[13] forcats_0.5.1 stringr_1.4.0 dplyr_1.0.8 purrr_0.3.4
[17] readr_2.1.2 tidyr_1.2.0 tibble_3.1.6 ggplot2_3.3.5
[21] tidyverse_1.3.1 rmarkdown_2.13 workflowr_1.7.0
loaded via a namespace (and not attached):
[1] minqa_1.2.4 colorspace_2.0-3 ellipsis_0.3.2 class_7.3-20
[5] rprojroot_2.0.3 fs_1.5.2 gld_2.6.5 rstudioapi_0.13
[9] proxy_0.4-27 farver_2.1.0 fansi_1.0.3 mvtnorm_1.1-3
[13] lubridate_1.8.0 xml2_1.3.3 splines_4.1.3 extrafont_0.18
[17] rootSolve_1.8.2.3 jsonlite_1.8.0 nloptr_2.0.0 broom_0.8.0
[21] Rttf2pt1_1.3.10 dbplyr_2.1.1 compiler_4.1.3 httr_1.4.2
[25] backports_1.4.1 assertthat_0.2.1 fastmap_1.1.0 cli_3.2.0
[29] later_1.3.0 htmltools_0.5.2 tools_4.1.3 gtable_0.3.0
[33] glue_1.6.2 lmom_2.9 Rcpp_1.0.8.3 carData_3.0-5
[37] cellranger_1.1.0 jquerylib_0.1.4 vctrs_0.4.1 nlme_3.1-155
[41] extrafontdb_1.0 xfun_0.30 ps_1.6.0 rvest_1.0.2
[45] lifecycle_1.0.1 getPass_0.2-2 MASS_7.3-55 scales_1.2.0
[49] hms_1.1.1 promises_1.2.0.1 expm_0.999-6 yaml_2.3.5
[53] Exact_3.1 gdtools_0.2.4 sass_0.4.1 stringi_1.7.6
[57] highr_0.9 e1071_1.7-11 boot_1.3-28 rlang_1.0.2
[61] pkgconfig_2.0.3 systemfonts_1.0.4 evaluate_0.15 lattice_0.20-45
[65] labeling_0.4.2 processx_3.5.3 tidyselect_1.1.2 plyr_1.8.7
[69] magrittr_2.0.3 R6_2.5.1 generics_0.1.2 DBI_1.1.2
[73] pillar_1.7.0 haven_2.5.0 whisker_0.4 withr_2.5.0
[77] abind_1.4-5 modelr_0.1.8 crayon_1.5.1 car_3.0-12
[81] utf8_1.2.2 tzdb_0.3.0 readxl_1.4.0 data.table_1.14.2
[85] callr_3.7.0 git2r_0.30.1 reprex_2.0.1 digest_0.6.29
[89] httpuv_1.6.5 munsell_0.5.0 bslib_0.3.1